Table dashboard
Note
This feature is a part of "Advanced data visualization" package.
Overview
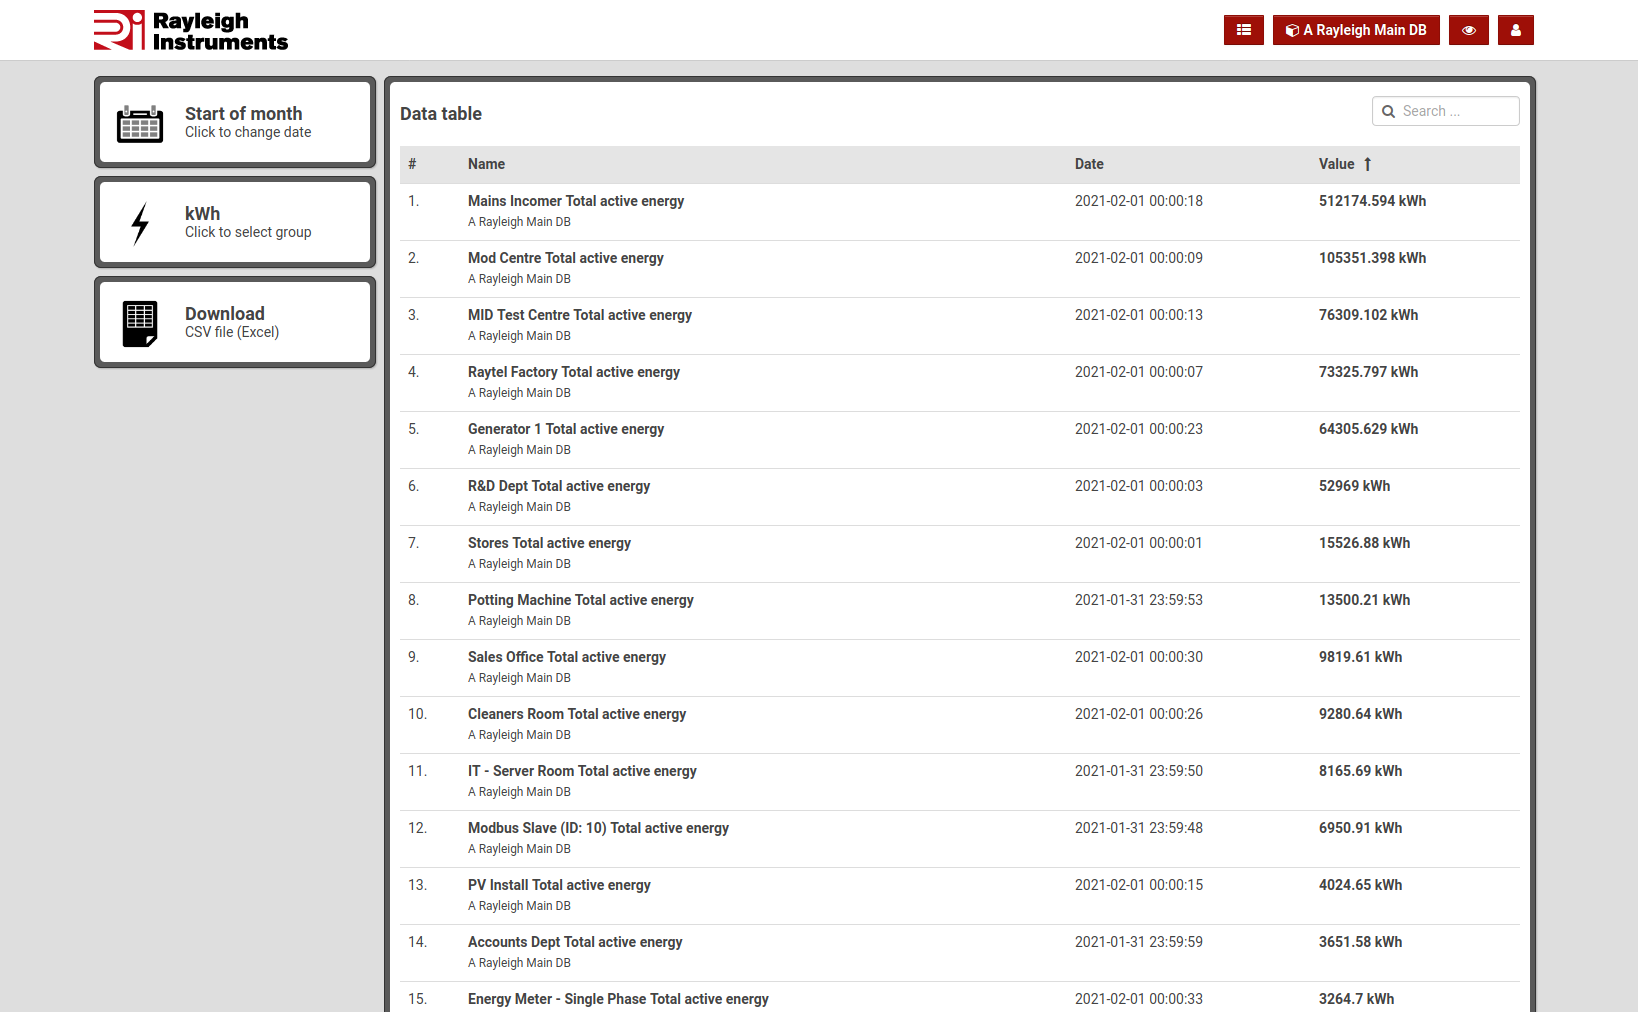
Table dashboard allows you to quickly prepare and export your energy consumption data in CSV (Excel) format.
Selecting date
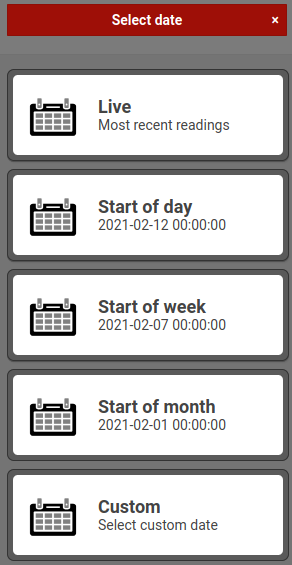
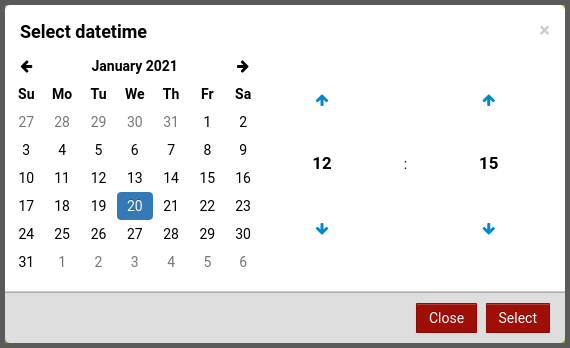
You can select one of predefined options or any custom date and time. Table dashboard will load readings from all meters and allow you to browse the data or export it as a CSV file.
Download sample files: