Widgets
Communication widget
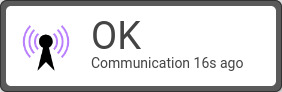
Communication widget is a standard widget available on all gateways. It displays:
- Communications status
- "OK" - under normal operation,
- "ERROR" - if there is no communication for extended period of time.
- Elapsed time since last communication.
Cellular signal strength and location widget
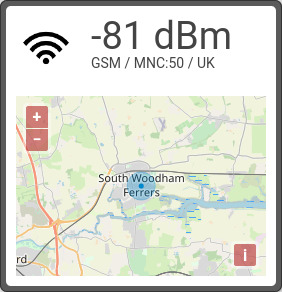
This widget displays:
- cellular signal strength in dBm
- operator name or MNC (Mobile Network Code)
- operator country or MCC (Mobile Country Code)
- map with locations of device from following sources:
- cell tower that the device is currently connected to.
- GNSS (GPS) if gateway is equipped with GNSS module.
- location set manually by user (requires active "Map & Location" package)
Icon changes depending on signal strength.
Clicking offers two actions:
- opening signal strength chart
- setting location manually (requires active "Map & Location" package)
Available on all gateways equipped with cellular modem.
Temperature sensor widget
Temperature sensors value is displayed on simple widgets with an thermometer icon. Name of the sensor can be customized.
Clicking on this widget opens archival data charts.
Phone number widget
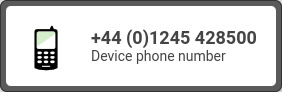
Phone number widget is displayed for all gateways that have a SIM card installed.
It functions as:
- Easy way to access incoming calls register (incoming calls can be configured to trigger relay output and hang up).
- Information that can be used to eg. send SMS commands to the gateways.
Weather widget
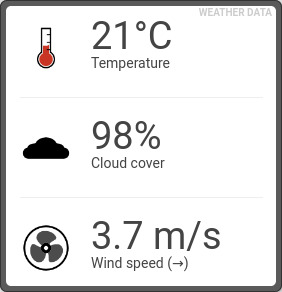
Displays weather information for current location of the device.
Available information:
- temperature
- cloud cover (useful for monitoring PV installations)
- wind speed (useful for monitoring wind turbines)
- wind direction
Requires:
- Active "Weather feature" subscription
- Source of device location or manually setting the device location
Not clickable.
Three-phase energy meter widget
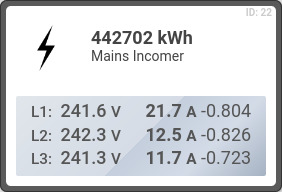
Basic widget for threephase energy meters.
Displays:
- active energy (kwh)
- if meter model provides both imported and exported energy this widget displays difference between them
- otherwise it displays imported energy
- voltage for each phase
- current for each phase
- power factor for each phase (if available)
Clicking offers two actions:
- opening energy meter chart
- accessing configuration modal
Extended energy meter widget
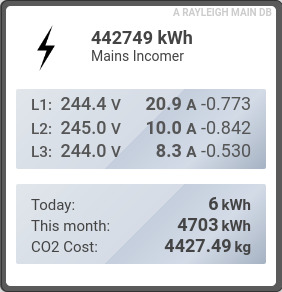
Extended energy meter widget is part of "Advanced Dashboards" feature.
This widget displays additional information for energy meters.
There are multiple choices of displayed information to fit different scenarios.
Digital input widget
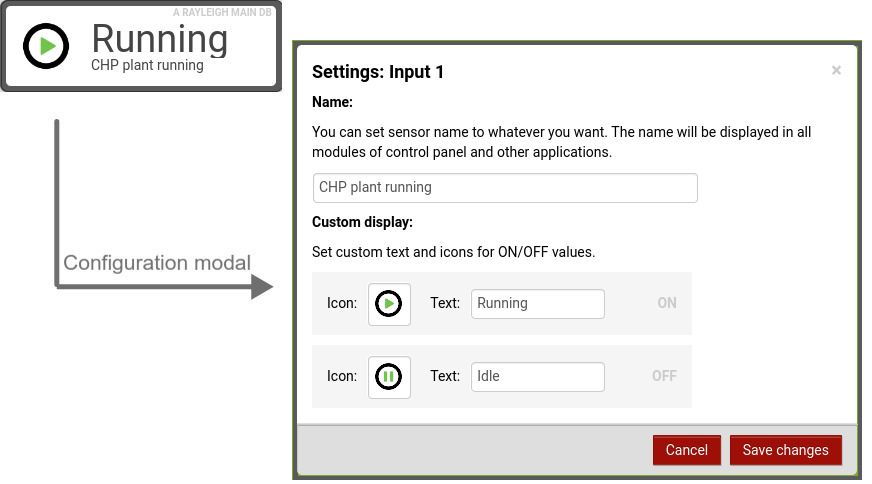
Digital input widgets are a standard feature used to display data from digital inputs (and outputs). It allows easy configuration of:
- Names for states (eg. 0 = Idle, 1 = Running)
- Icons for states
- Name of input
Analog input widget
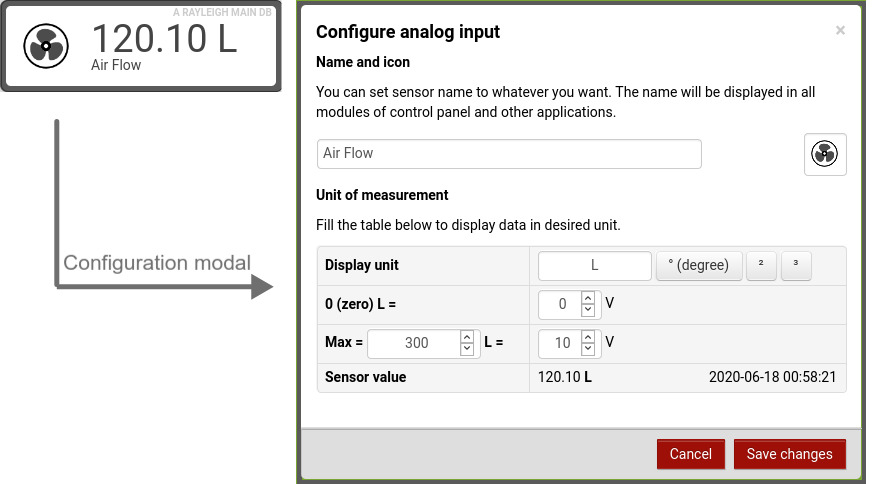
Analog input widgets are a standard feature used to display value from analog sensors. It provides easy configuration of:
- Display unit
- Value conversion formula
- Name
- Icon
Renewable energy generation widget
Note
Renewable energy generation widget is part of "Advanced Dashboards" package.
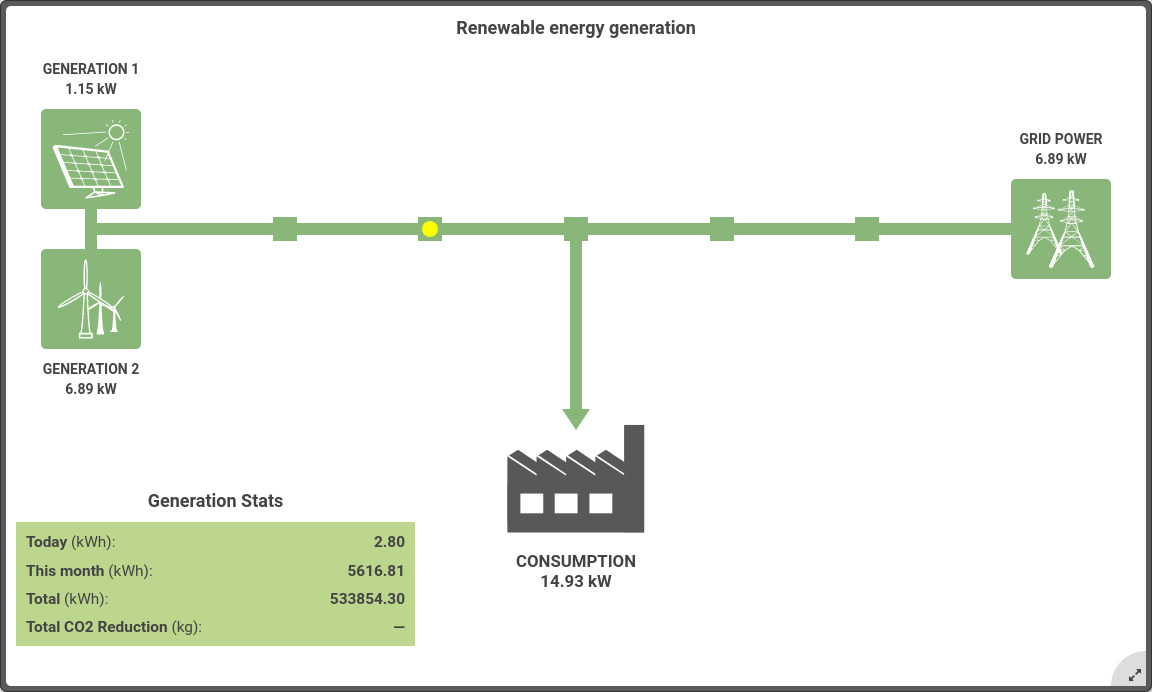
Multiple energy meters (or even "virtual energy meters") can be assigned to:
- two energy generation sources
- grid energy source
Icons are configurable for both generation sources and consumption.
Consumption and generation statistics will be calculated automatically. \ Additionaly CO2 factor can be assigned to meters to get CO2 reduction figures.
Pump station widget
Note
Pump station widget is part of "Advanced Dashboards" package.
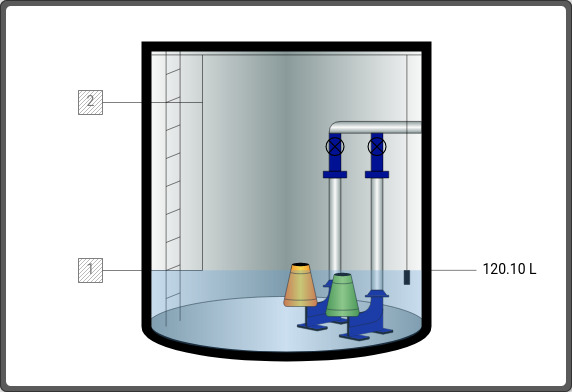
It is a highly customizable widget for displaying:
- working status (on/off) of one or two pumps
- error status (0/1) of one or two pumps
- liquid level in container via analog sensors
- liquid level in container via digital sensors
Any digital input (eg. gateway`s built-in inputs) can be freely assigned to provide one of above information.
Any analog sensors can be easily configured (formula to calculate Voltage or Current signal to liters or any other unit) and used to display liquid level.
This widget was designed for monitoring of waste pump stations.
Logo widget
Note
Logo widget is part of "Advanced Dashboards" package.
Logo widget can be used to display custom image.
It is available in multiple sizes and features an image cropper and resizer.
Run hours widget
Note
Run hours widget is part of "Advanced Dashboards" package.
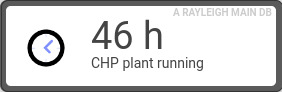
Any digital input (0/1) can be assigned to this widget.
Based on:
- 0/1 status of selected digital input
- configured time period (today, last 7 days, last 30 days, custom)
this widget will diplay duration of high state of the input.
Unit of time can also be configured (hours, minutes, etc).
It was designed to calculate running time of machines to allow for monitoring of service intervals.
Chart widget
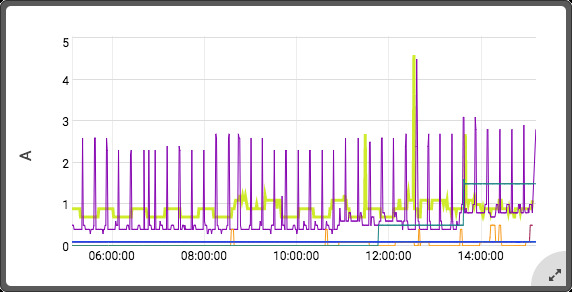
Chart widget is part of "Advanced Dashboards" feature. However there is also a standard feature called charts module. This information is regarding a widget which can be placed on an advanced dashboard with other widgets.
Any sensor (or sensors in case of "Advanced charts") can be displayed as a chart widget on an advanced dashboard.
Virtual sensor widget
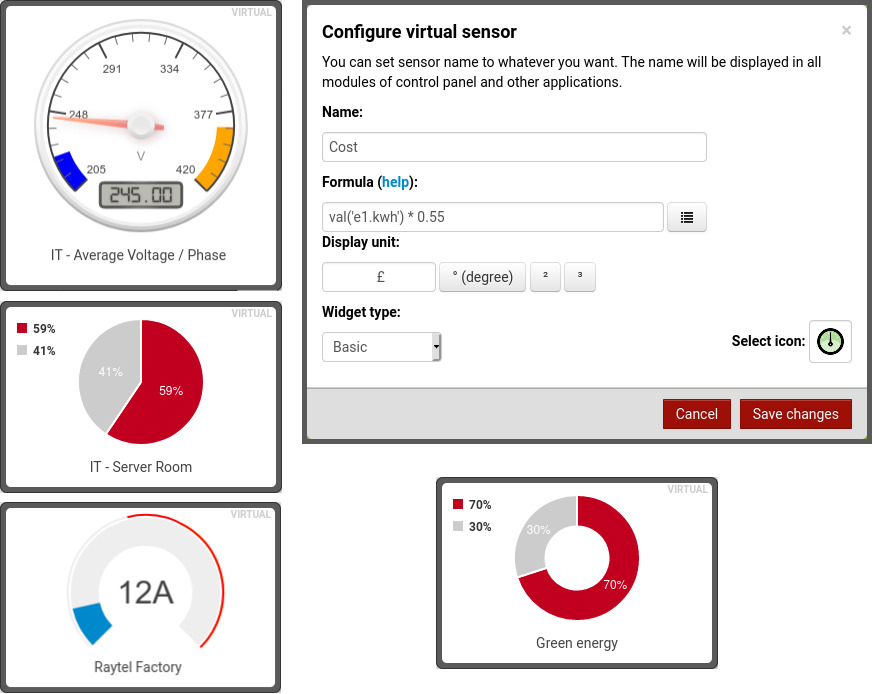
Virtual sensors allow displaying value calculated using:
- data from any sensors
- mathematical formulas
This powerful tool can can display gauges, piecharts, textual information, etc.
Data calculated by virtual sensors can also be viewed in charts module.