Overview
Dashboards are an integral part of rayleighconnect™, providing users with a centralized platform to visualize and analyze energy data in real-time. They play a crucial role in offering actionable insights into energy consumption patterns, enabling users to effectively monitor, analyze, and manage energy usage within their facilities. For detailed instructions on utilizing specific dashboard features, please refer to the respective documentation pages.
Key features
Widgets
Dashboards contain collections of widgets, each representing various energy meters, inverters, gensets, sensors, or other data sources. Widgets come with visualization options such as charts, gauges, and more, providing users with insightful representations of energy data.
Dashboard Types
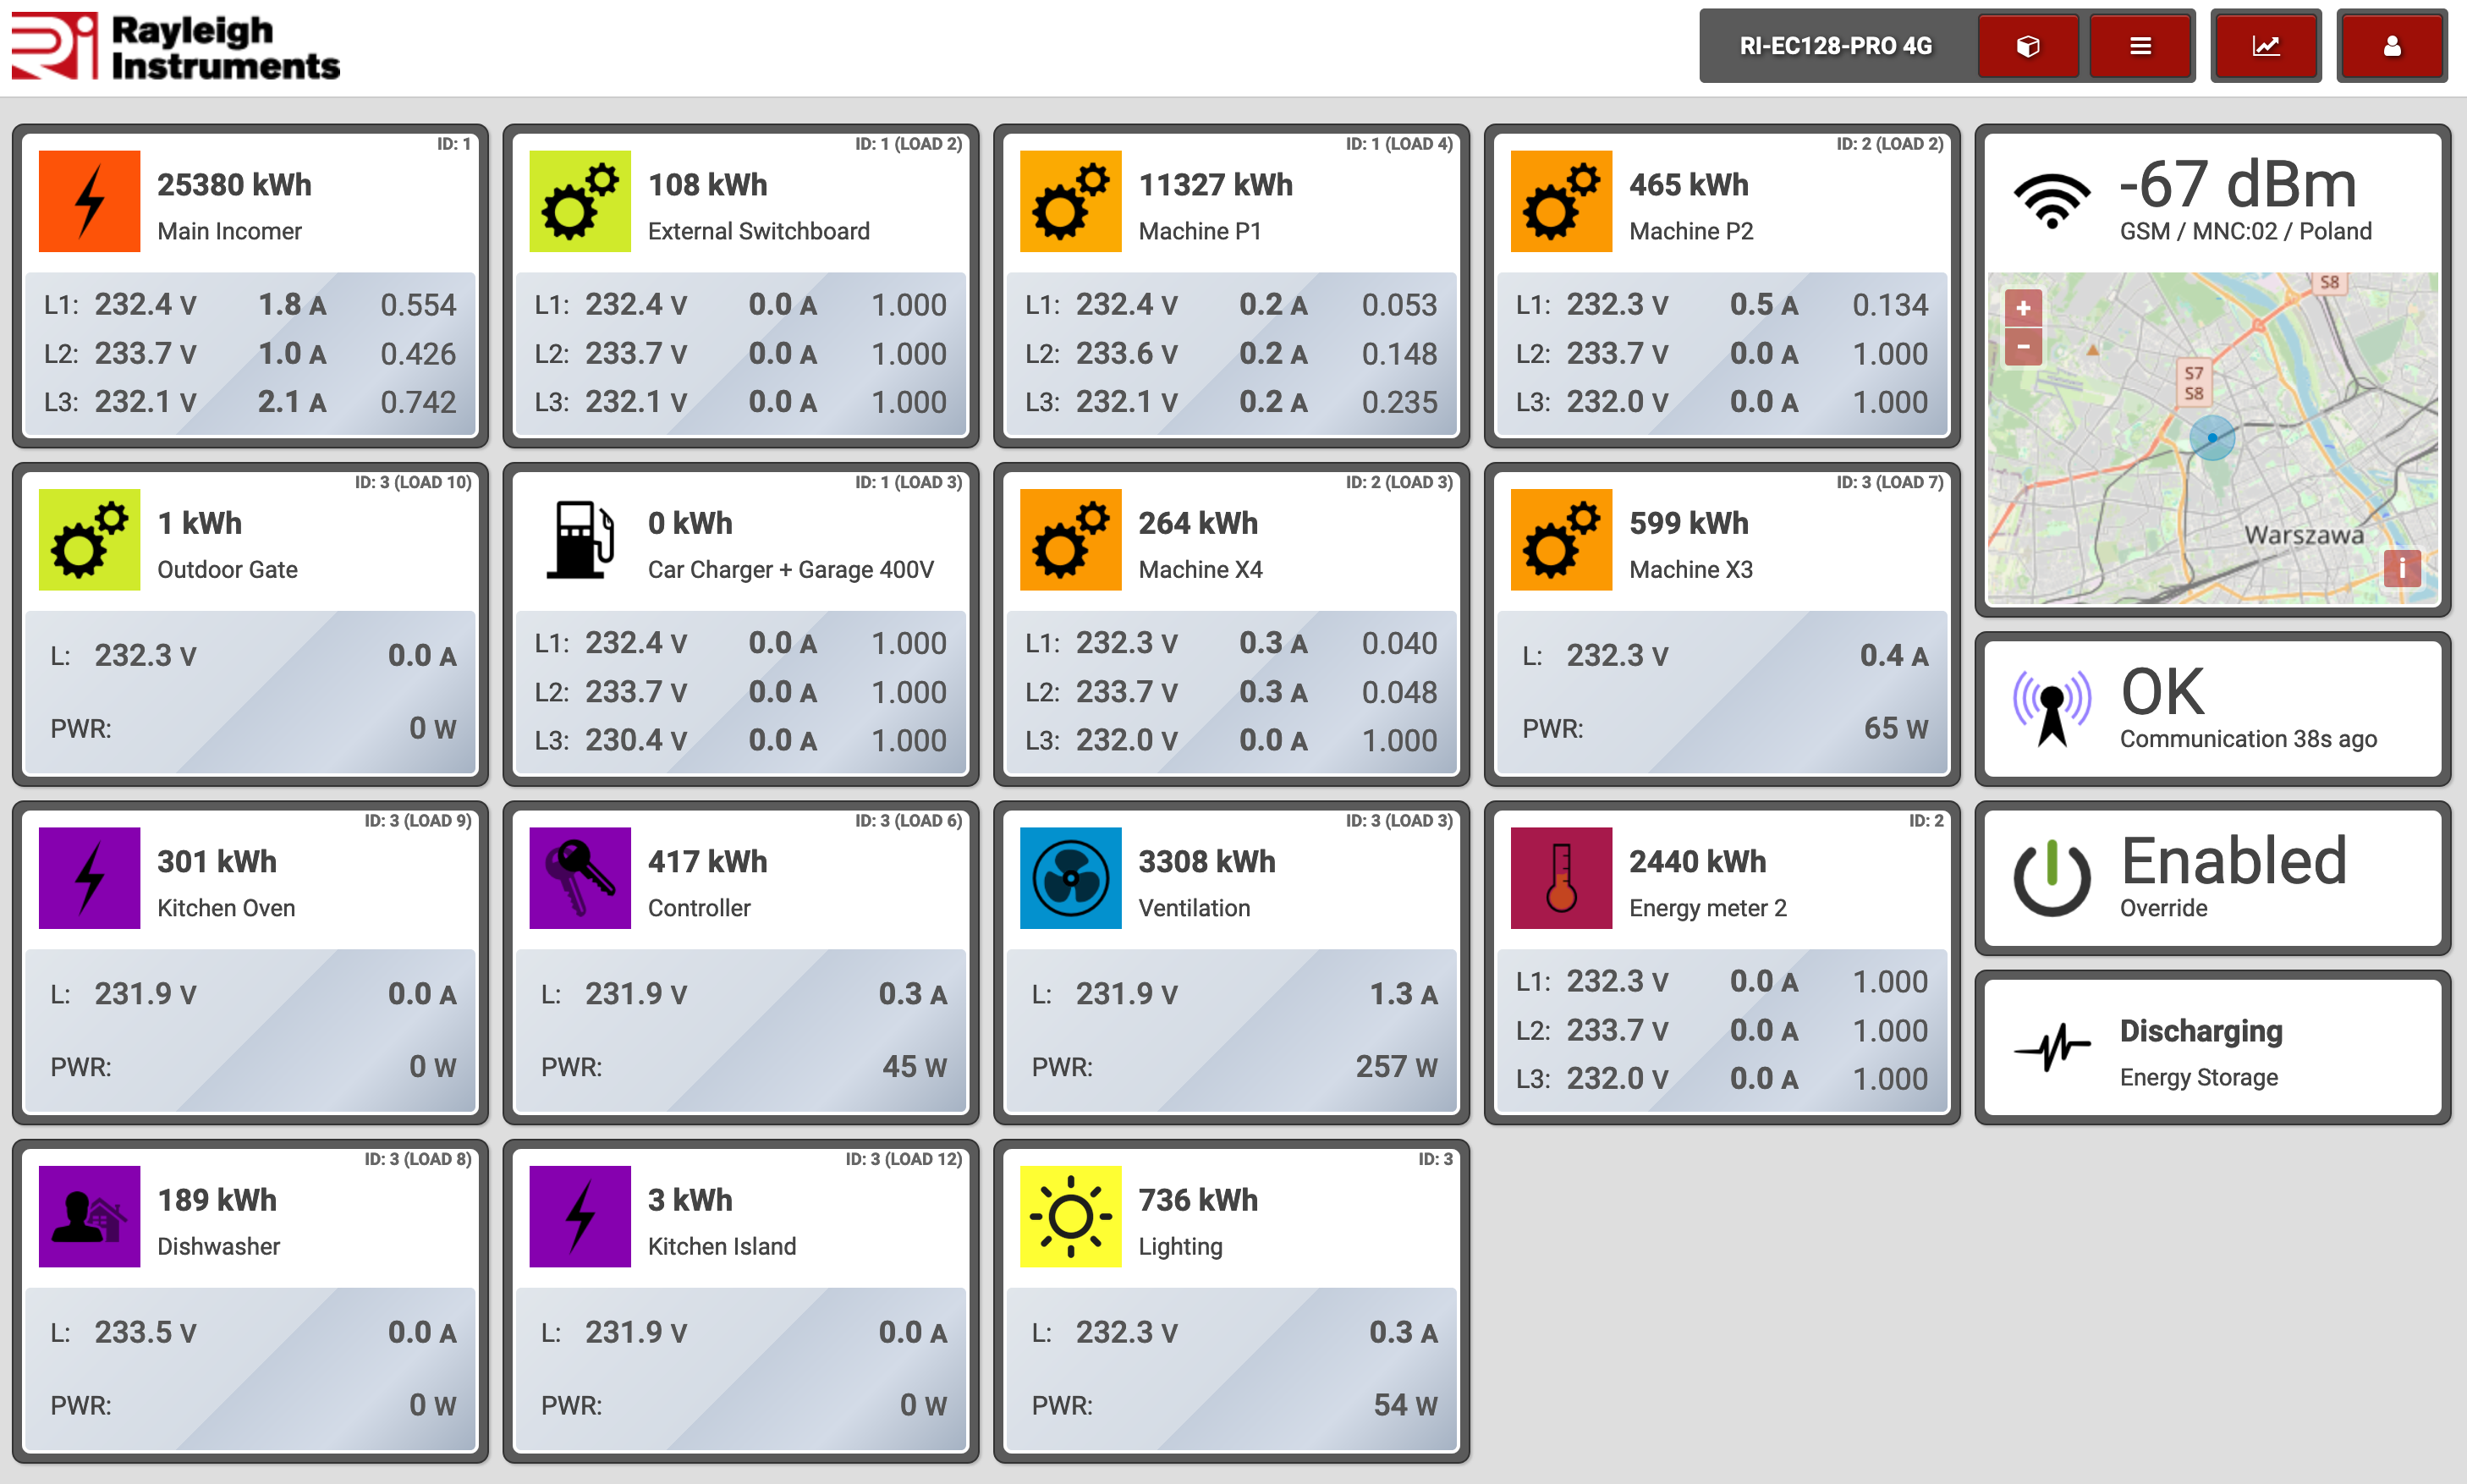
Gateway dashboard
Each of your gateways have its own dashboard where meters and sensors are displayed. Depending on gateway model and connected devices different widgets will be displayed.
These dashboards offer a quick overview of key energy metrics associated with the gateway.
Custom dashboards
Users have the flexibility to create personalized dashboards tailored to their specific monitoring needs. Custom dashboards allow for the arrangement of widgets according to individual preferences.
Map & Location dashboard
Specialized dashboard that display energy data overlaid on map. Ideal for monitoring energy consumption across different geographical locations.
Navigation dashboards
Custom navigation dashboards are personalized user interfaces designed to allow to tailor the layout, organization, and accessibility of key features or data points within a system.
Switchboard
Mimicking the layout of an electrical switchboard, these dashboards provide a unique visual representation of energy flow and distribution within a system.
Functionality
-
Widget Management
Users can easily add, remove, and rearrange widgets within dashboards to customize the display of energy data according to their preferences.
-
Visualization Options
Dashboards offer a variety of visualization types, including charts, gauges, tables, and maps, allowing users to choose the most suitable representation for their energy metrics.
-
Real-Time Updates
Dashboards provide continuous, real-time updates of energy data, ensuring that users have access to the latest information and can make timely decisions based on current conditions.
-
Data Interaction
Users can interact with widgets to access detailed information, zoom in on specific time periods, or adjust parameters for deeper analysis, enhancing their ability to derive insights and identify trends in energy consumption.