Bar Charts
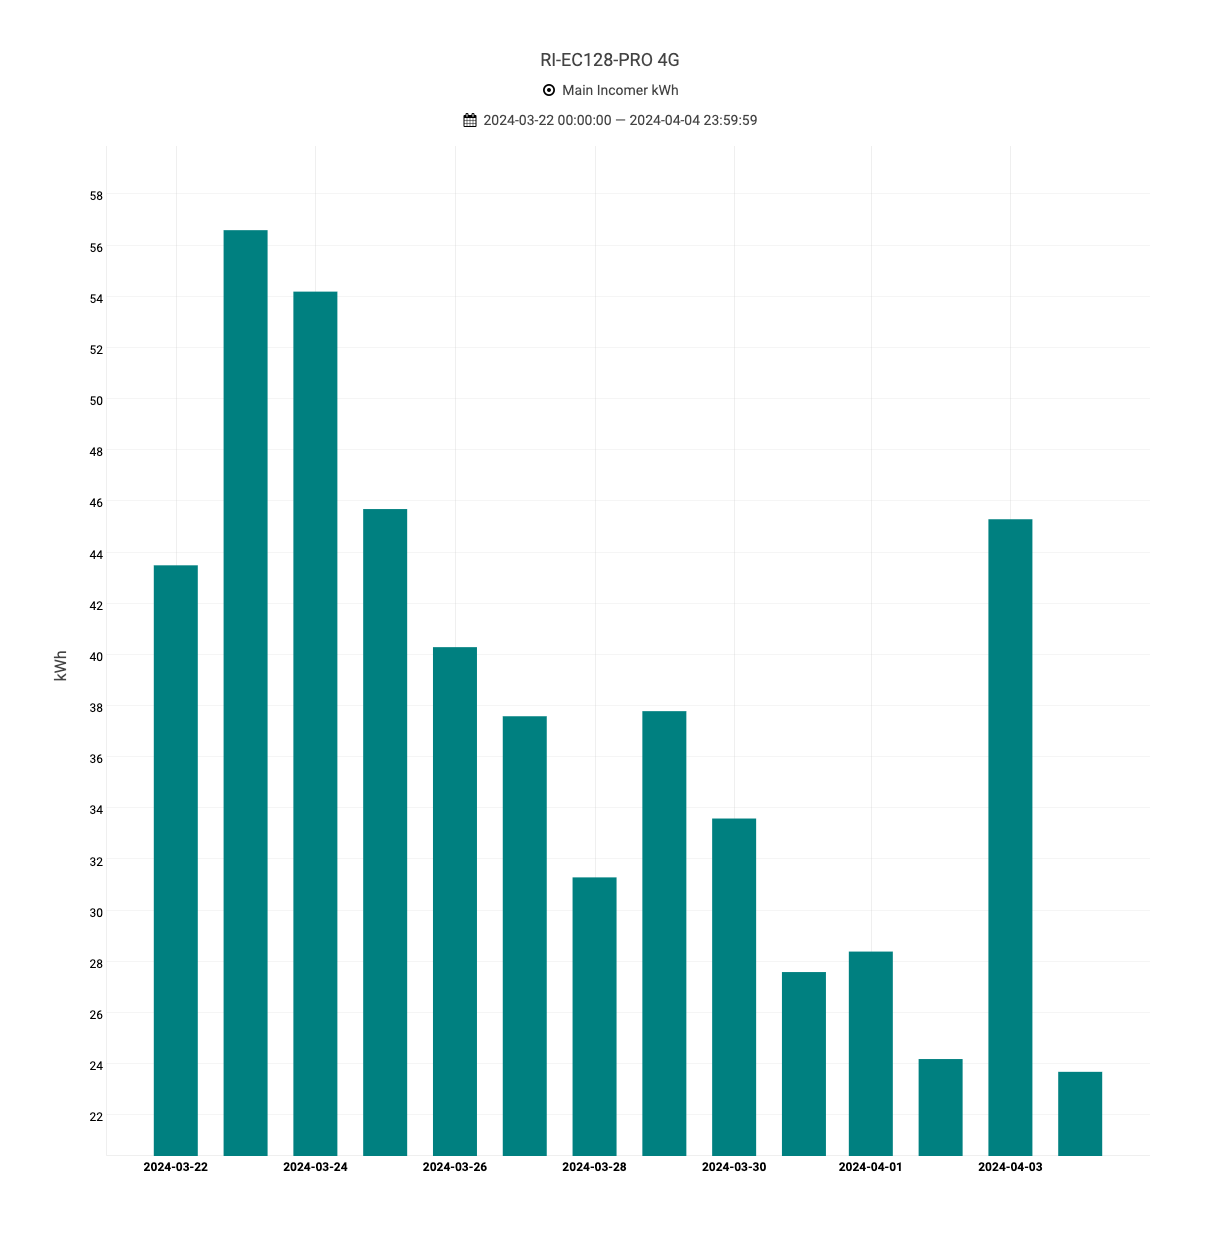
Column Charts for Energy Consumption
Bar charts provide a clear visualization of energy consumption across different time periods, such as minutely, hourly or daily.
Each bar represents the amount of energy consumed within a specific timeframe, allowing users to quickly identify peak consumption periods and trends.
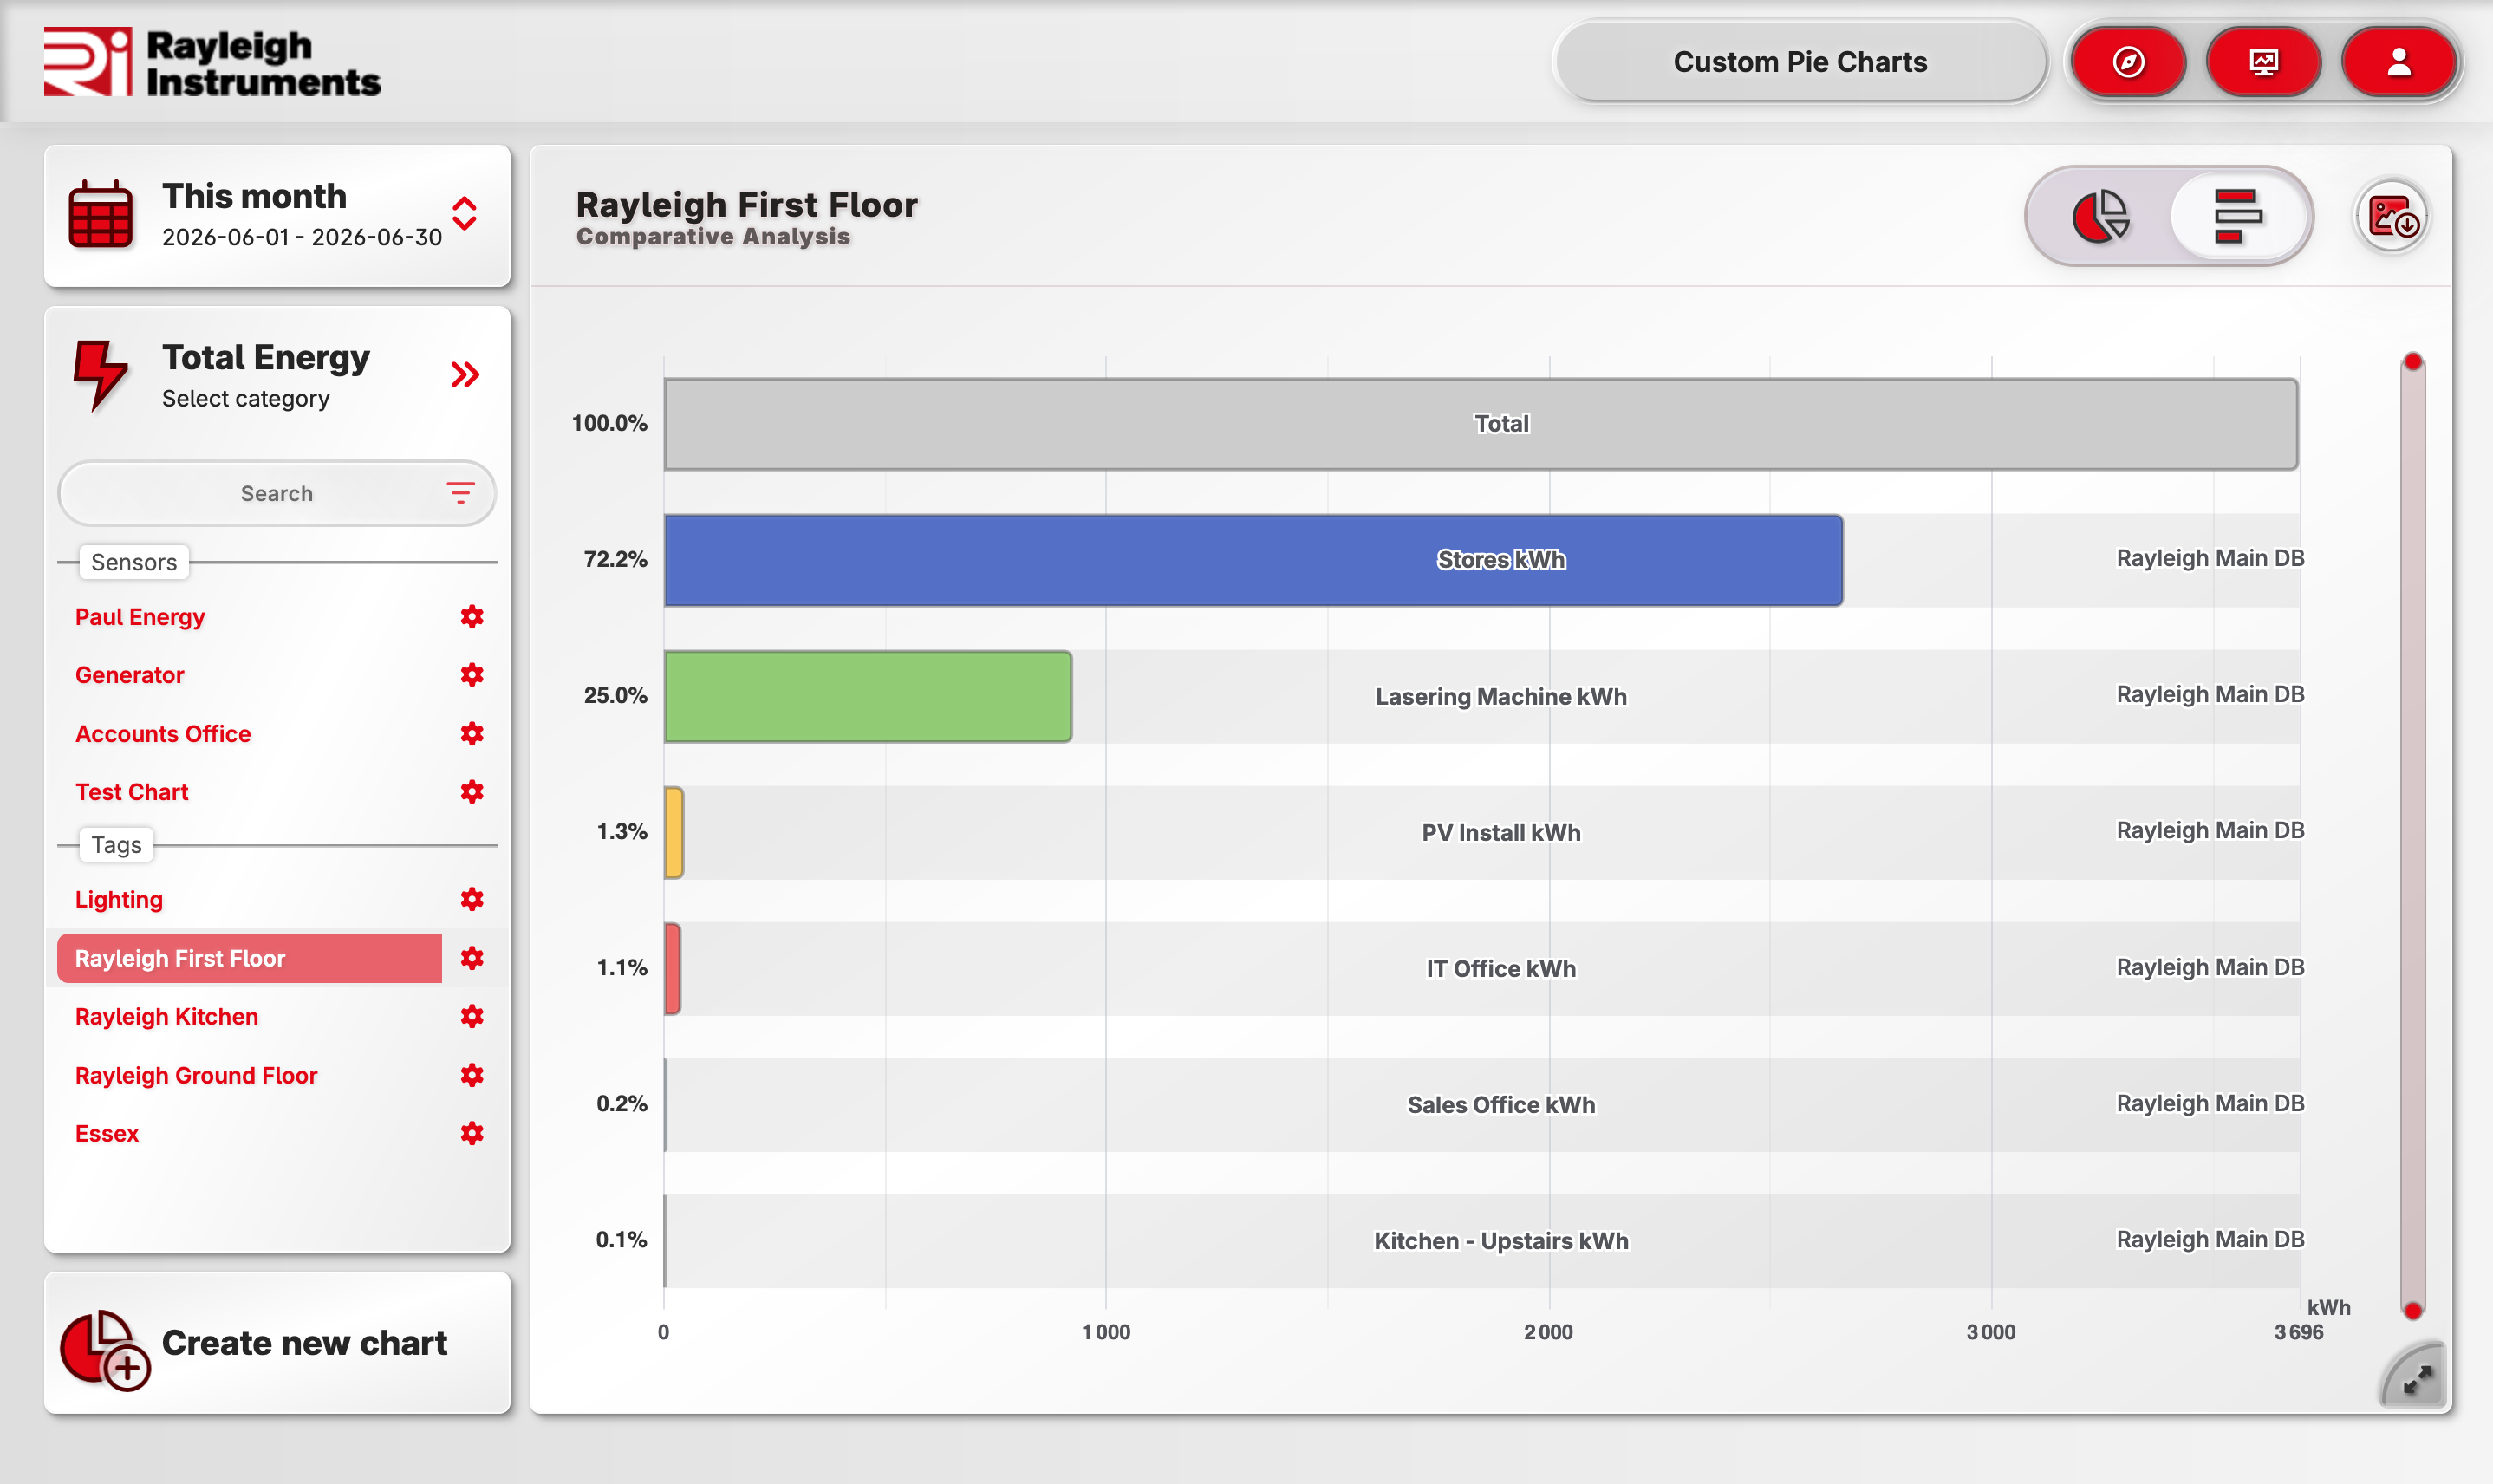
Pie Charts bars chart mode
Pie charts can be toggled with a single click to a bar chart.